
(Tom: This was written for US figures but no prizes for you if you figure the Australian situation is similar.)
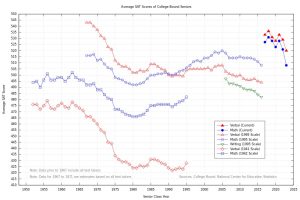
Per the people who keep track of the S.A.T. scores in Princeton, in 1963, the average S.A.T. MATHEMATICS score for high school seniors who wanted to go on to college, was “502”.
Figures were recently released showing that the S.A.T. MATH scores for graduating seniors today is “466”.
Keep in mind that the test has been getting easier. For example, in 1963, you received 1 pt for a correct answer and lost 1/4 pt for a wrong answer. Today, you receive 1 pt for a correct answer and you lose no points for wrong answers, which means that it pays you to guess.
Finally, the 1963 test was 4 hours long. The new, on-line, test is 2 hours and 15 minutes long. That includes Math and English comprehension. The questions, as long as I have been a proctor for the exam, have become much easier.
Clearly, math is being de-emphasized in the high schools.
In 2016, the college board tried to adopt an “Adversity Score” which was based upon the applicants Zip code and how many ‘free lunches’ were given in his/her school. Since then, the general population has complained mightily against this score, asking, how does a single diversity number measure the applicant’s ability to do well in college? The diversity score has since been abandoned.
Finally, the new, on-line, SAT test senses how well you are doing in part One. If you aren’t doing that well, it will provide subsequent questions that are easier in parts 2,3 and 4. Conversely, if you are doing well, it provides more difficult questions. When they score your test, the number of right answers coupled with the point rating of the difficulty of the questions answered, are used to calculate your actual score. They are still taking into consideration a more level playing field, but sacrificing overall quantitative accuracy. Do the research yourself.