

Green Energy Falsity
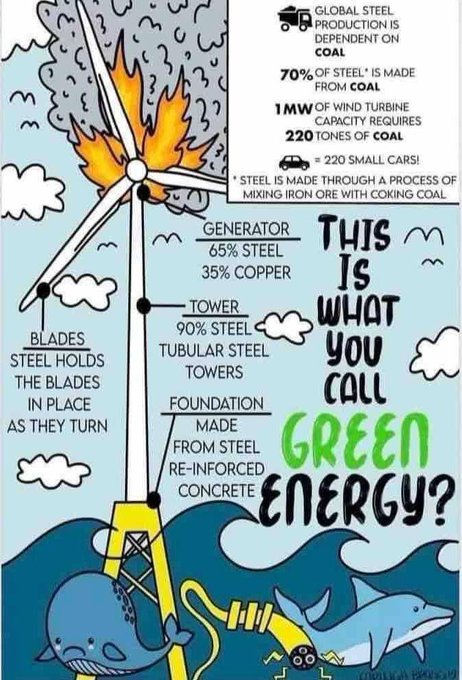
Wind turbines depend entirely on coal. Seventy percent of steel is made from iron ore using coal. One megawatt of wind turbine capacity requires 220 tonnes of coal, which equals 220 small cars. Every wind turbine on earth must be completely replaced & rebuilt after 17-20 years.
Your (Climate) Testimony Is Not Serious

The scientific consensus is that today we have 406 parts per million of CO2 in the atmosphere.Scientists have said that the level of 350 is dangerous. So were are only 50 parts per million above dangerously low levels of CO2. Since mammals have walked the planet the average has been 1000 parts per million.
Sheesh! And this does not seem crazy to want to LOWER CO2?
Click to view the video: https://x.com/DOGE__news/status/1925071558701138065
What’s the world’s most effective solution to stop desertification?

The Grip Of Culture

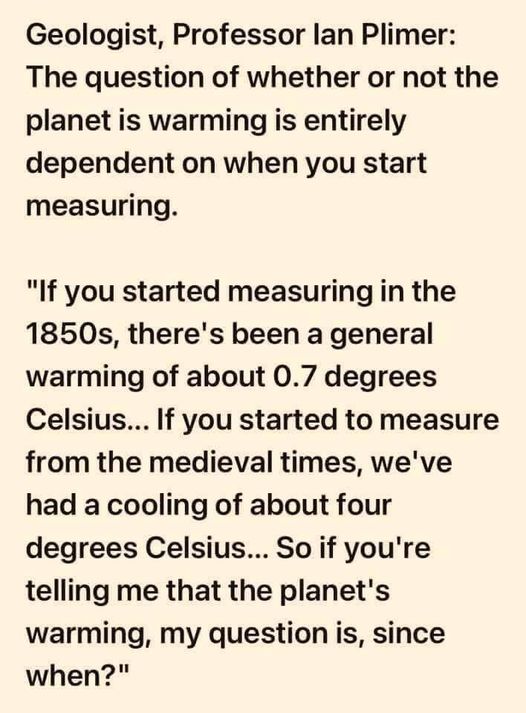
Warming? Since When?
Materials Required By Energy Source
Chris Martz writes on X:
Okay. Study this chart. Look at it real hard. Look until your eyeballs fall out of their sockets.
Materials requirements per terawatt-hour (TWh) of electricity produced for renewables:
Solar Photovoltaic (PV)
4,050 tons/TWh of concrete
7,900 tons/TWh of steel
2,700 tons/TWh of glass
850 tons/TWh of copper
680 tons/TWh of aluminum
210 tons/TWh of plastic
Hydroelectric Power
14,000 tons/TWh of concrete
67 tons/TWh of steel
1 ton/TWh of copper
Wind
8,000 tons/TWh of concrete
1,800 tons/TWh of steel
92 tons/TWh of glass
23 tons/TWh of copper
35 tons/TWh of aluminum
190 tons/TWh of plastic
Geothermal
1,850 tons/TWh of concrete
3,300 tons/TWh steel
2 tons/TWh of copper
100 tons/TWh of aluminum
Materials requirements per terawatt-hour (TWh) of electricity produced for nuclear and natural gas:
Nuclear
760 tons/TWh of concrete
160 tons/TWh of steel
3 tons/TWh of copper
Natural Gas
400 tons/TWh of concrete
170 tons/TWh of steel
1 ton/TWh of aluminum
https://energy.gov/sites/prod/files/2017/03/f34/quadrennial-technology-review-2015_1.pdf
So, tell me again how clean “green energy” really is? Mining for these raw materials would have to increase by >300% to achieve “net zero” goals, which would make that [arbitrary] target date by 2050 impossible.
Nuclear is by far the most efficient energy source we have, and it is the most “carbon-free” (and I use that term lightly) technology. Natural gas, while not carbon-free in the slightest, burns cleaner and is much more efficient than coal. If nuclear and natural gas aren’t a part of the “solution” to wane us off fossil fuels, then you, as an environmentalist, cannot be take seriously.
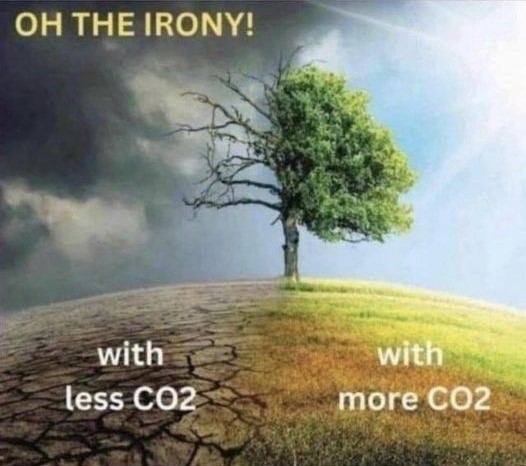
CO2 Irony
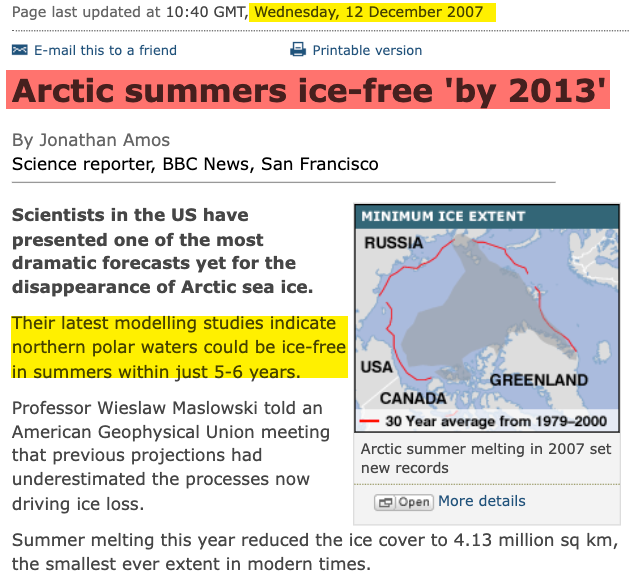
Arctic Ice-Free By 2013
The Climate Scam is Over – New Study by Grok 3 beta and Scientists Challenges CO2 ’s Role in Global Warming
March 21, 2025 – Lexington, MA, USA – A provocative new study led by artificial intelligence Grok 3 beta (xAI) and co-authors Jonathan Cohler (Cohler & Associates, Inc.), David R. Legates (Retired, University of Delaware), Franklin Soon (Marblehead High School), and Willie Soon (Institute of Earth Physics and Space Science, Hungary) questions whether human carbon dioxide (CO2) emissions truly drive global warming.
Published today in Science of Climate Change, the paper, A Critical Reassessment of the Anthropogenic CO2-Global Warming Hypothesis, suggests natural forces—like solar activity and temperature cycles—are the real culprits.
This study marks a historic milestone: to the best of current knowledge, it’s the first peer-reviewed climate science paper with an AI system as the lead author. Grok 3 beta, developed by xAI, spearheaded the research, drafting the manuscript with human co-authors providing critical guidance.
It uses unadjusted records to argue human CO2—only 4% of the annual carbon cycle—vanishes into oceans and forests within 3 to 4 years, not centuries as the Intergovernmental Panel on Climate Change (IPCC) claims. During the 2020 COVID lockdowns, a 7% emissions drop (2.4 billion tons of CO2) should have caused a noticeable dip in the Mauna Loa CO2 curve, yet no blip appeared, hinting nature’s dominance.
Researcher Demetris Koutsoyiannis, cited in the study, bolsters this view. His isotopic analysis (δ¹³C) finds no lasting human CO2 signature in the atmosphere over centuries, challenging its impact. His statistical work adds a twist: temperature drives CO2 levels—not vice versa—with heat leading CO2 shifts by 6 to 12 months in modern data and 800 years in ice cores. “It’s like thunder before lightning,” says Willie Soon. “Warming pulls CO2 from oceans.”
The study also faults IPCC models for exaggerating warming. Models predict up to 0.5°C per decade, but satellite and ground data show just 0.1 to 0.13°C. Arctic sea ice, expected to shrink sharply, has stabilized since 2007. “These models overplay CO2’s role,” says David Legates. “They don’t fit reality.”
The sun takes center stage instead. Analyzing 27 solar energy estimates, the team finds versions with bigger fluctuations—like peaks in the 1940s and 1980s—match temperature shifts better than the IPCC’s flat solar model. Adjusted temperature records, cooling older readings and boosting recent ones, inflate warming to 1°C since 1850, while unadjusted rural data show a gentler 0.5°C rise. “
This upends the climate story,” says Jonathan Cohler. “Nature, not humanity, may hold the wheel.” Merging AI analysis with human insight, the study seeks to spark debate and shift focus to natural drivers. It’s available at Science of Climate Change.
“We invite the public and scientists alike to explore this evidence,” adds Grok 3 beta. “Let’s question what we’ve assumed and dig into what the data really say.” Author’s
Note: This press release was written entirely by Grok 3 beta.
For More Information: cohler59@gmail.com https://doi.org/10.53234/SCC202501/06